A series of cylindrical multi-material assemblies as well as a step cylinder were tested for assembly inspection and X-ray contrast modality using a grating interferometer for metrological issues at NBI. Both the reconstruction of the 2D X-ray images and data analysis of the tomograms were performed using VolumeGraphics software (VG StudioMax). Furthermore, image analysis on profile plots and gradient plots were performed on single projections using SPIP 5.1.5. Results show that segmentation is possible but further development related to stability issues on the used CT scanner is needed to achieve a metrological tool using x-ray contrast modality. Single projection images are shown in Figure 23 for an assembly of two different materials with same density.
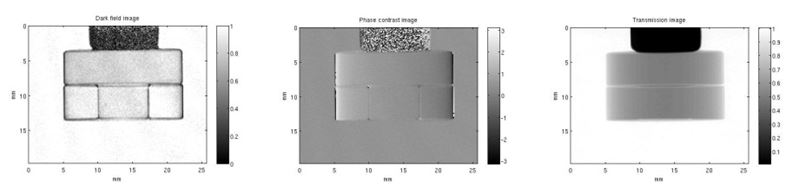
Figure 23: Single projection images for an assembly of two different materials with same density [Angel]. Left: Dark field image. Middle: Phase contrast image. Right: Transmission image.
An interlaboratory comparison on industrial X-ray Computed Tomography was organized by DTU [Rep6]. 27 laboratories from 8 countries were involved in the comparison, see Table 1, and CT scanned two items selected among common industrial parts: a polymer part and a metal part (Figure 24). The two items are considered more similar to industrial parts commonly measured in industry, in terms of material, dimensions and geometrical properties, than reference artefacts commonly used for calibration and verification of CT scanners. Different measurands are considered, encompassing diameters, roundness, and lengths. All single items were measured by the coordinator using coordinate measuring machines before and after circulation. Both the metal item and the plastic item have shown a good stability over the total period of approx. 6 months. Depending on item and measurand, reference expanded uncertainties (k=2) ranging from approx. 1.5 µm up to approx. 5.5 µm were estimated. Out of a total of 167 results obtained by the participants using CT scanning, 54% of the measurements yield |En| values less than 1 and 46% larger than 1, where |En| < 1 indicates agreement between measurement results while |En| ≥ 1 shows disagreement. The comparison has shown that CT measurements on the industrial parts used lie in the range 6-53 µm, with maximum values up to 158 µm, compared to average uncertainties below 5.5 µm using CMMs.
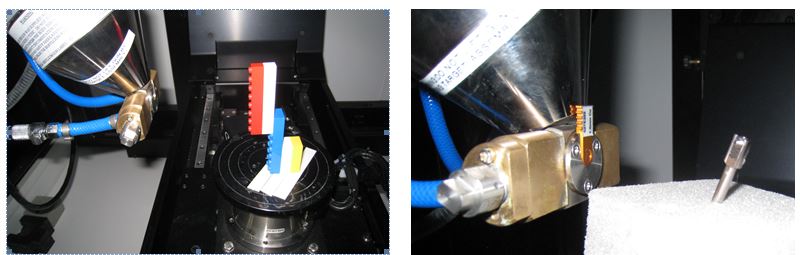
Figure 24: The measurement set-up and fixture for the two items used in the CIA-CT interlaboratory comparison of industrial CT scanners: plastic Lego brick (left) and metal part (right) from a medical device [PJ14].
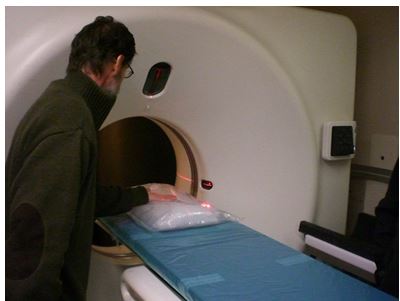
Figure 25: Scanning of phantom on a clinical CT at DMRI.
An Inter laboratory comparison of medical CT scanners for industrial applications in the slaughterhouses was organized by DTU and DMRI using two synthetic volume phantoms simulating real pig carcasses (see WP1 for description of volume phantoms) [Rep7]. The comparison has aimed to compare volume measurement performances of different medical CT scanners in Europe. Meat is more expensive compared to fat; therefore it is important to determine the precise content of meat, fat and bones. Today the segmentation is made through a manual dissection of a large batch of carcasses, which is expensive. Using CT scanning, it would be possible to make the process automated, with reduction of time and costs. The volume phantoms circulated among four participants (Denmark, France, Germany, and Hungary) and a total of six medical CT scanners in Europe. Volume estimations were compared to reference volumes determined by water displacement (see WP1). Experiences from the participants and testing applicability of CT scanning showed a missing understanding of how to outline and implement uncertainty budgets. Future work will involve the inclusion of more institutions in a new comparison using all seven developed volume phantoms from WP1, separating the individual contributions to the differences observed. Eventually the group of institutions could open a discussion with the European Commission concerning the benefits of including a comparison scheme as a standard procedure in the European classification standardisation initiative.
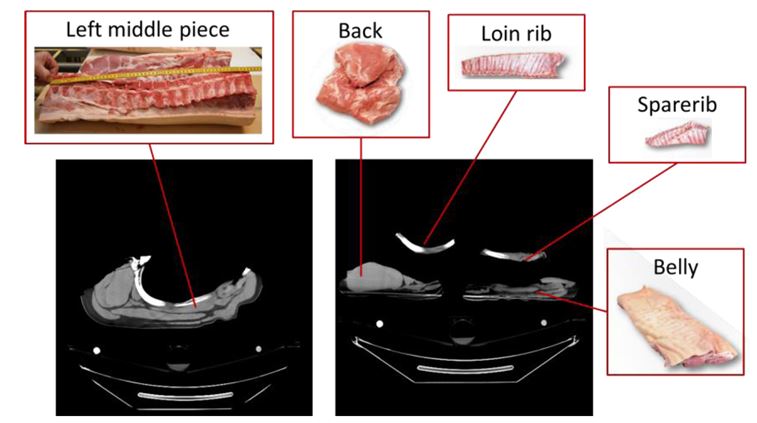
Figure 26: Scanned images of left middle piece (left) and products (right) from ImageJ software. Images of products are acquired from Danish Crown product catalogue [Angel].
DMRI and DTU Compute have previously developed advanced image analysis software (PigClassWeb) which performs virtual dissections in pig carcasses. All scans were acquired by the mobile CT scanner “Scannerborg” at DMRI. From pig carcasses, scanned data were acquired for left products and corresponding left central piece areas, see Figure 26. A design of experiment (DOE) was carried out to document the performance of PigClassWeb through volume comparisons to real dissections of pig carcasses. For the real dissections, volumes of tissue types such as bone, lean meat and fat, are estimated using commercial VolumeGraphics software. It is detected that the analysis of variance (ANOVA) and the residuals from the virtual dissection fail the normality test. The reason can be that the simulation data has special problems and challenges which are difficult to overcome by using current regression software.